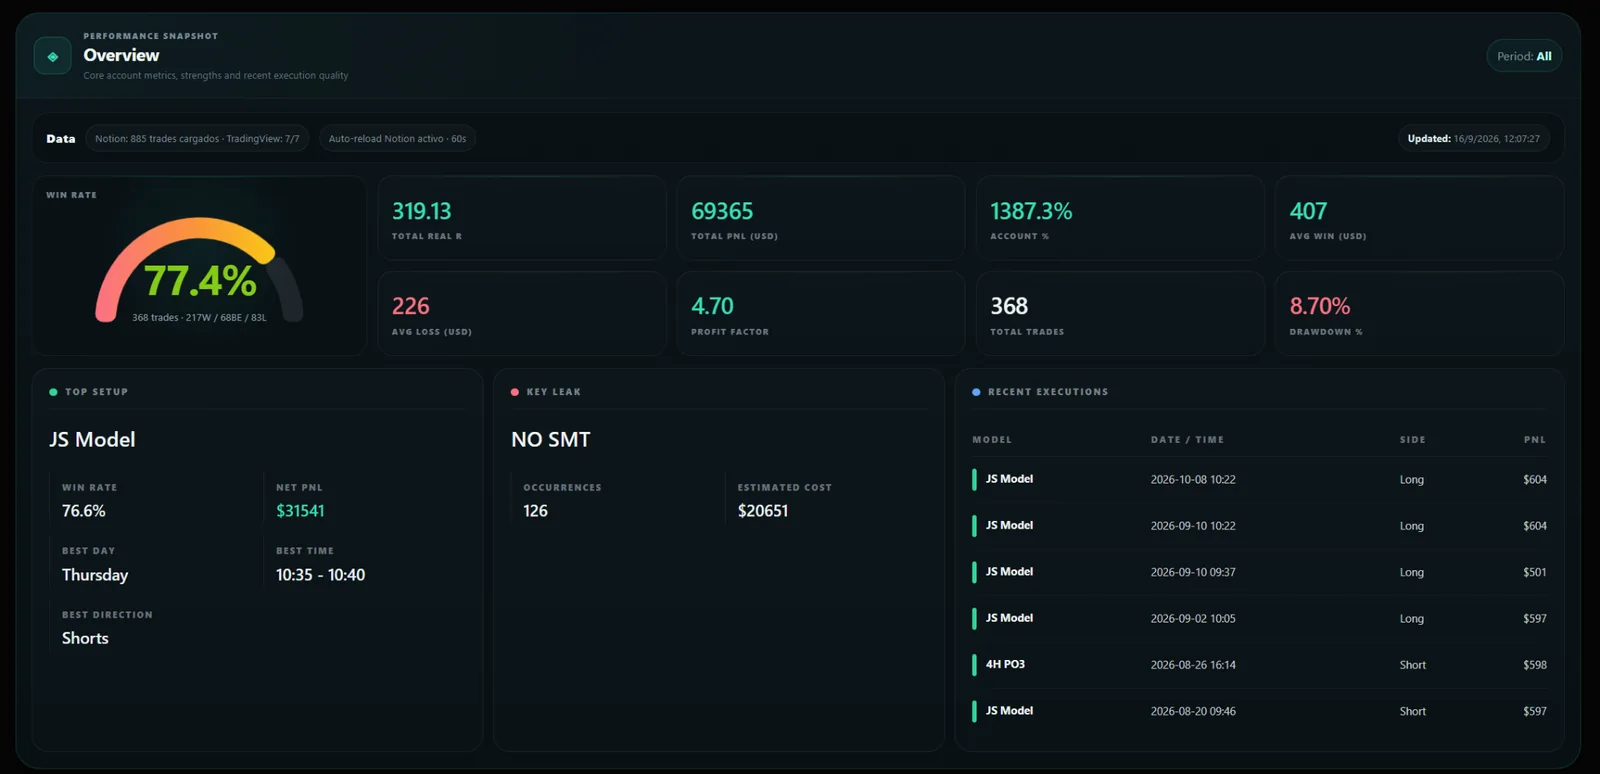
A trading dashboard built to explain your results
From a metric to the trades behind it
Review Profit Factor, win rate, equity and drawdown over a chosen period. Then filter by setup, account or time slot to find the trades behind a number. Metrics describe what happened; your notes and context help you interpret it.
Performance
Compare PnL, Profit Factor and win rate by model. One result alone does not establish the quality of a process.
Risk
View drawdown next to the equity curve. Check the sample size before drawing conclusions.
Context
Separate sessions, accounts, long and short trades. Open trade details and review recorded mistakes.
Import
Upload a compatible CSV and check the trades detected.
Classify
Add model and account context to the trades you want to study.
Filter
Choose a period and compare variables while keeping trade details visible.
Review
Open the trades behind each pattern and record what you learned.
Frequently asked questions
Answers about importing, your Journal and reviewing your trades.
What does the trading dashboard show?
Performance and risk metrics, a calendar and trade details, with filters for period, model, account, time and direction.
Does it cover NQ and MNQ?
Yes. The analysis workflow includes NQ and MNQ. One NQ point is $20 per contract; one MNQ point is $2, before costs.
Does the dashboard give trading signals?
No. It is for reviewing historical data and your process, not for signals or investment advice.
Review your history with more context
Start with the free plan and see which questions your own trade data can answer.
★ Also on the Notion Marketplace: see the free template →
An analytics and educational tool. It does not provide signals or financial advice.